> ## Documentation Index
> Fetch the complete documentation index at: https://docs.leapter.com/llms.txt
> Use this file to discover all available pages before exploring further.
# Test your Blueprint
> Set inputs in the Contents sidebar, run manually or with Live mode, and step through any execution to debug.
You test Blueprints directly in the [Blueprint Editor](/fundamentals/leapter-canvas/introduction). The Contents sidebar is the entry point: expand any Blueprint's parameters, set its input values, and run.
## Quick Run from the Contents sidebar
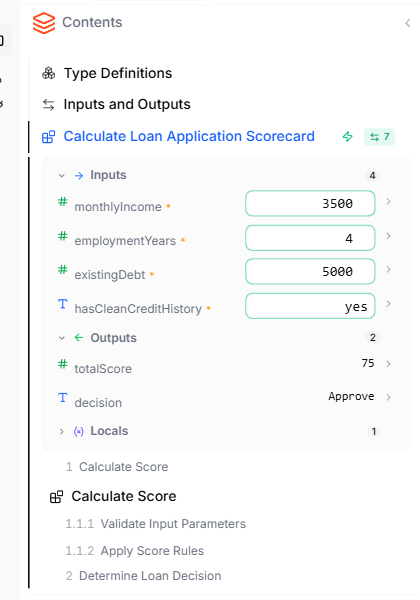 1. **Open the Contents sidebar** on the left of the editor.
2. **Click the `# N` badge** next to a Blueprint — N is the count of its parameters. The Blueprint expands to show its inputs and outputs in line.
3. **Set values for the inputs.** Each input has a control matching its type — a dropdown for enums, a number field for numbers, a text field for strings, and so on. Required inputs are marked.
4. **Run the Blueprint.** Either run it once, or leave [Live mode](#live-mode) running and the Blueprint re-runs automatically every time you change an input or edit the logic.
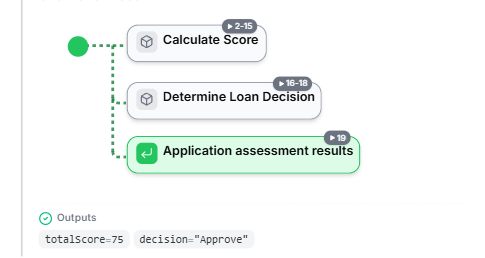
5. **Read the outputs.** Each output shows its current value next to its name in the Contents sidebar, and the **Outputs footer** at the bottom of the Blueprint's section in the document does too.
After a run:
* The **execution path** is highlighted on the embedded diagram, showing which branches and elements were visited.
* Each visited element shows a **step number** so you can see the order of execution.
* The **trace controls** in the [top toolbar](/fundamentals/leapter-canvas/introduction#top-toolbar) become active for stepping through the execution.
The Blueprint you set values on doesn't have to be the active [Execution Scope](/fundamentals/leapter-canvas/inputs-and-outputs#execution-scope-and-the-projects-external-interface) — you can quick-run any Blueprint in isolation to test it.
## Live mode
1. **Open the Contents sidebar** on the left of the editor.
2. **Click the `# N` badge** next to a Blueprint — N is the count of its parameters. The Blueprint expands to show its inputs and outputs in line.
3. **Set values for the inputs.** Each input has a control matching its type — a dropdown for enums, a number field for numbers, a text field for strings, and so on. Required inputs are marked.
4. **Run the Blueprint.** Either run it once, or leave [Live mode](#live-mode) running and the Blueprint re-runs automatically every time you change an input or edit the logic.
5. **Read the outputs.** Each output shows its current value next to its name in the Contents sidebar, and the **Outputs footer** at the bottom of the Blueprint's section in the document does too.
After a run:
* The **execution path** is highlighted on the embedded diagram, showing which branches and elements were visited.
* Each visited element shows a **step number** so you can see the order of execution.
* The **trace controls** in the [top toolbar](/fundamentals/leapter-canvas/introduction#top-toolbar) become active for stepping through the execution.
The Blueprint you set values on doesn't have to be the active [Execution Scope](/fundamentals/leapter-canvas/inputs-and-outputs#execution-scope-and-the-projects-external-interface) — you can quick-run any Blueprint in isolation to test it.
## Live mode
 The **live-execution control** in the [top toolbar](/fundamentals/leapter-canvas/introduction#top-toolbar) is a **play / pause button** that runs your Blueprints continuously. While live execution is running (the button shows a pause icon), Leapter re-runs the Blueprint automatically every time you change an input value or edit the logic, and the Outputs footer of every section updates as you edit. Pause it to stop auto-running; resume it to turn continuous execution back on.
Live mode is most useful for:
* **Tweaking values** — adjusting a threshold or rate and seeing every output update at once
* **Reviewing edge cases** — flipping a boolean input and watching which branch becomes active
* **Pair-editing with AI** — applying [AI changes](/fundamentals/change-your-blueprint/ai-editing) and confirming the outputs immediately
* **Reading an unfamiliar project** — turn it on and you can see real values flowing through every Blueprint as you scroll the document
Pause it when you want to make several edits without intermediate runs.
## Stepping through a trace
The **live-execution control** in the [top toolbar](/fundamentals/leapter-canvas/introduction#top-toolbar) is a **play / pause button** that runs your Blueprints continuously. While live execution is running (the button shows a pause icon), Leapter re-runs the Blueprint automatically every time you change an input value or edit the logic, and the Outputs footer of every section updates as you edit. Pause it to stop auto-running; resume it to turn continuous execution back on.
Live mode is most useful for:
* **Tweaking values** — adjusting a threshold or rate and seeing every output update at once
* **Reviewing edge cases** — flipping a boolean input and watching which branch becomes active
* **Pair-editing with AI** — applying [AI changes](/fundamentals/change-your-blueprint/ai-editing) and confirming the outputs immediately
* **Reading an unfamiliar project** — turn it on and you can see real values flowing through every Blueprint as you scroll the document
Pause it when you want to make several edits without intermediate runs.
## Stepping through a trace
 After any run, the **trace controls** in the [top toolbar](/fundamentals/leapter-canvas/introduction#top-toolbar) become active. They let you replay the execution one step at a time across every Blueprint that ran.
| Control | Action |
| :--------------------- | :-------------------------------------------------------------------------------------------------------------------------------------------------------------- |
| **Jump to first step** | Go to the first step of the trace |
| **Previous step** | Go back one step |
| **Step counter** | Shows the current step number — click to jump to a specific step |
| **Next step** | Advance one step |
| **Jump to last step** | Go to the final step |
| **Step into** | When the current step is on a [Call node](/fundamentals/leapter-canvas/calling-other-blueprints), descend into the called Blueprint and continue stepping there |
| **Step out** | When you're inside a sub-Blueprint, return to the parent and continue stepping there |
| **Exit trace** | Exit replay mode and return to editing |
While stepping, the active node is highlighted on whichever diagram contains it. Variable values at the current step are visible on the embedded diagram and in the Outputs footer.
The editor is **read-only** while a trace is active — exit the trace to resume editing.
### Autoplay
The trace toolbar also has a **play / pause** button and a **playback speed** control for animating through the trace automatically:
* **Play** — auto-advance through every step in order. The button toggles to a pause icon while running.
* **Pause** — stop the auto-advance at the current step. The button toggles back to the play icon.
* **Speed** — adjust how fast autoplay moves through the trace.
Autoplay pauses on its own as soon as you take manual control — clicking a step in the diagram, hitting prev / next, jumping to start or end, or stepping in or out. It also pauses automatically when the trace reaches its last step.
The same play / pause + speed controls appear in [embedded viewers](/executing-blueprints/embed) (where you can opt-in via the `autoplay` attribute on ``) and in [public read-only shares](/fundamentals/sharing).
## What to do next
* **[Test Suites](/fundamentals/test-suites)** — create and auto-generate test suites for systematic testing
* **[Inputs and Outputs](/fundamentals/leapter-canvas/inputs-and-outputs)** — see how Blueprint signatures work
* **[Logic & Descriptions](/fundamentals/change-your-blueprint/sync-and-suggestions)** — let AI catch drift between your descriptions and your logic
After any run, the **trace controls** in the [top toolbar](/fundamentals/leapter-canvas/introduction#top-toolbar) become active. They let you replay the execution one step at a time across every Blueprint that ran.
| Control | Action |
| :--------------------- | :-------------------------------------------------------------------------------------------------------------------------------------------------------------- |
| **Jump to first step** | Go to the first step of the trace |
| **Previous step** | Go back one step |
| **Step counter** | Shows the current step number — click to jump to a specific step |
| **Next step** | Advance one step |
| **Jump to last step** | Go to the final step |
| **Step into** | When the current step is on a [Call node](/fundamentals/leapter-canvas/calling-other-blueprints), descend into the called Blueprint and continue stepping there |
| **Step out** | When you're inside a sub-Blueprint, return to the parent and continue stepping there |
| **Exit trace** | Exit replay mode and return to editing |
While stepping, the active node is highlighted on whichever diagram contains it. Variable values at the current step are visible on the embedded diagram and in the Outputs footer.
The editor is **read-only** while a trace is active — exit the trace to resume editing.
### Autoplay
The trace toolbar also has a **play / pause** button and a **playback speed** control for animating through the trace automatically:
* **Play** — auto-advance through every step in order. The button toggles to a pause icon while running.
* **Pause** — stop the auto-advance at the current step. The button toggles back to the play icon.
* **Speed** — adjust how fast autoplay moves through the trace.
Autoplay pauses on its own as soon as you take manual control — clicking a step in the diagram, hitting prev / next, jumping to start or end, or stepping in or out. It also pauses automatically when the trace reaches its last step.
The same play / pause + speed controls appear in [embedded viewers](/executing-blueprints/embed) (where you can opt-in via the `autoplay` attribute on ``) and in [public read-only shares](/fundamentals/sharing).
## What to do next
* **[Test Suites](/fundamentals/test-suites)** — create and auto-generate test suites for systematic testing
* **[Inputs and Outputs](/fundamentals/leapter-canvas/inputs-and-outputs)** — see how Blueprint signatures work
* **[Logic & Descriptions](/fundamentals/change-your-blueprint/sync-and-suggestions)** — let AI catch drift between your descriptions and your logic