> ## Documentation Index
> Fetch the complete documentation index at: https://docs.leapter.com/llms.txt
> Use this file to discover all available pages before exploring further.
# Summary
> The totals for your production runs in a time window, broken down by public Blueprint.
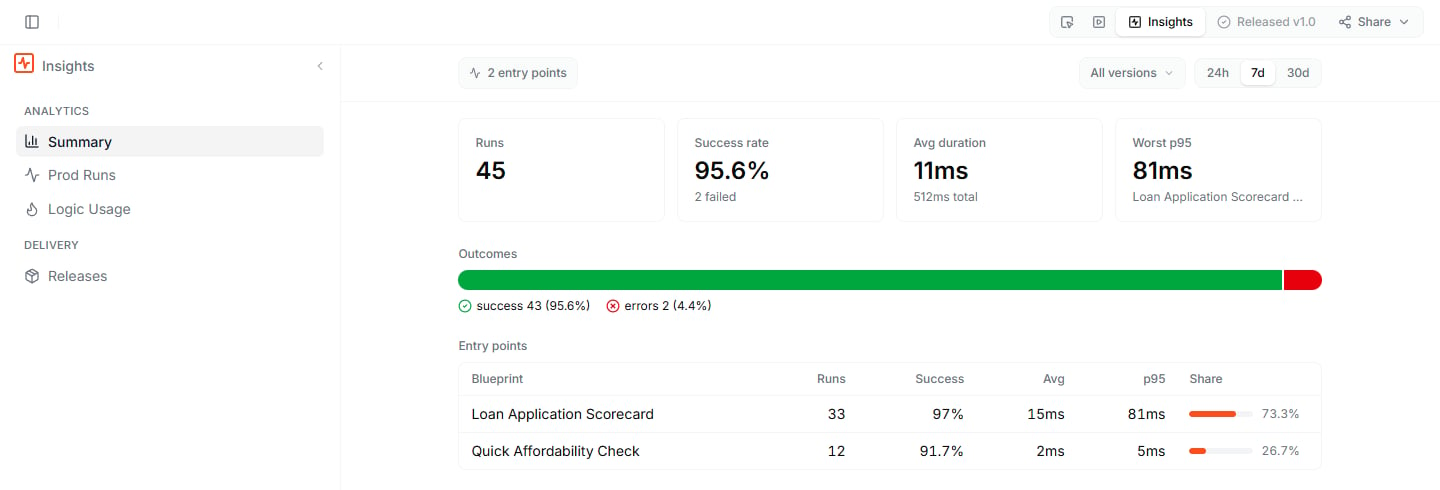
The **Summary** in [Insights](/insights/overview) adds up the production runs in the selected time window and version, so you can see how many calls your project received and how they ended.
 ## The tiles
| Tile | What it shows |
| :- | :- |
| **Runs** | How many production runs there were |
| **Success rate** | The share of runs that succeeded, with the number of failed runs |
| **Avg duration** | The average run time |
| **p95 duration** | 95% of runs finished within this time. If the project has several public Blueprints, the tile is called **Worst p95** and names the entry point with the slowest p95. |
## Outcomes and entry points
The **Outcomes** bar splits all runs into successes, errors, and timeouts.
The **Entry points** table breaks the numbers down by public Blueprint: **Runs**, **Success**, **Avg**, **p95**, and **Share** of all runs.
## What to do next
* **[Prod Runs](/insights/prod-runs)**: look at the single runs behind the totals
* **[Logic Usage](/insights/logic-usage)**: see which parts of your logic the runs reach
This documentation is built and hosted on [Mintlify](https://mintlify.com), a developer documentation platform.
## The tiles
| Tile | What it shows |
| :- | :- |
| **Runs** | How many production runs there were |
| **Success rate** | The share of runs that succeeded, with the number of failed runs |
| **Avg duration** | The average run time |
| **p95 duration** | 95% of runs finished within this time. If the project has several public Blueprints, the tile is called **Worst p95** and names the entry point with the slowest p95. |
## Outcomes and entry points
The **Outcomes** bar splits all runs into successes, errors, and timeouts.
The **Entry points** table breaks the numbers down by public Blueprint: **Runs**, **Success**, **Avg**, **p95**, and **Share** of all runs.
## What to do next
* **[Prod Runs](/insights/prod-runs)**: look at the single runs behind the totals
* **[Logic Usage](/insights/logic-usage)**: see which parts of your logic the runs reach
This documentation is built and hosted on [Mintlify](https://mintlify.com), a developer documentation platform.