The Share menu
All deployment options start from the Share button in the Blueprint Editor toolbar. Click it to see the available options: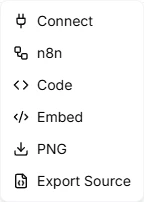
| Option | What it does |
|---|---|
| Connect | Get API endpoints for MCP or REST API integration |
| n8n | Export ready-made n8n workflows (HTTP, Code, or MCP Agent) |
| Code | View your Blueprint as JavaScript or Python code |
| Embed | Get an HTML snippet to embed an interactive Blueprint viewer |
| PNG | Download a static image of your Blueprint |
| Export Source | Download the project’s source files for use with the Leapter CLI or version control |
| Link | Generate a public read-only link so anyone can read the project’s Specification view — no Leapter account required (rolling out behind a feature flag; may not be available in your environment yet) |
Deployment options
Connect via API
Leapter exposes your published Blueprints through two protocols:- AI Protocol (MCP) — connect AI assistants and agents using the Model Context Protocol. Ideal for Claude Desktop, Cursor, and other MCP-compatible tools.
- Web API (OpenAPI) — call your Blueprints through a standard REST API from any application. Includes a full OpenAPI specification.
Export to n8n
Leapter can generate complete n8n workflows that you import directly into n8n:- HTTP Workflow — calls your deployed Blueprint via HTTP API
- Code Workflow — runs your Blueprint logic directly as JavaScript inside n8n, with no external API calls
- MCP Agent Workflow — creates an AI agent that uses your Blueprints as tools
View as code
Export as Code shows your Blueprint logic transpiled to JavaScript or Python. Use it for code review, porting logic to other systems, or documentation.Embed in websites
Embed in Websites gives you an HTML snippet with a web component that renders an interactive, read-only view of your Blueprint. No authentication required — the Blueprint data is embedded directly in the code.Monitor production runs
After you deploy a Blueprint, you can monitor its executions in the Prod Runs panel inside the Blueprint Editor.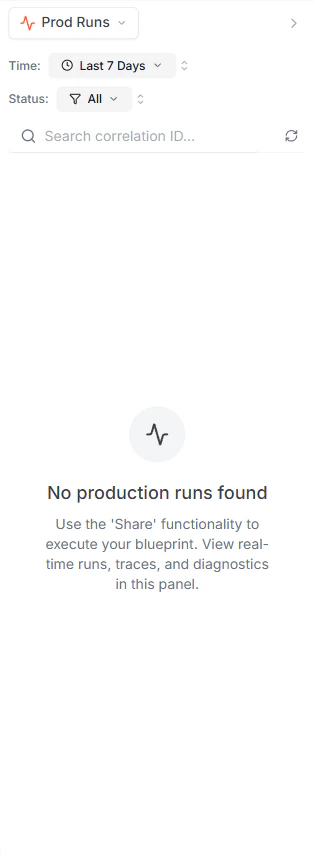
- Status — whether the run succeeded or failed
- Timestamp — when the run occurred
- Duration — how long the execution took (e.g., 303ms)
- Runtime — which runtime executed the Blueprint (e.g., Script:Node.js)
Inspecting a run
Click on any run to expand it and see:- Input — the exact data that was sent to the Blueprint
- Output — the result the Blueprint returned
- Trace data — the step-by-step execution path through your Blueprint
Replaying a run
Each expanded run has a Replay button. Clicking it re-executes the Blueprint with the same inputs as the original run. This is useful for debugging issues or verifying that a fix works correctly after you update your Blueprint.Filtering runs
Use the filters at the top of the panel to narrow down the results:- Time — filter by time range (e.g., Last 7 Days, Last 24 Hours)
- Status — show all runs or filter by success/failure
- Search — find a specific run by its correlation ID
What to do next
- API Keys — create API keys to authenticate your integrations
- AI Protocol (MCP) — connect AI assistants to your Blueprints
- Web API (OpenAPI) — integrate with any application via REST