

Read the usage
Choose a Blueprint with Select blueprint. Leapter shows its diagram as it was in the selected release and marks every node with the share of runs that reached it. A node shown in red failed in at least one run.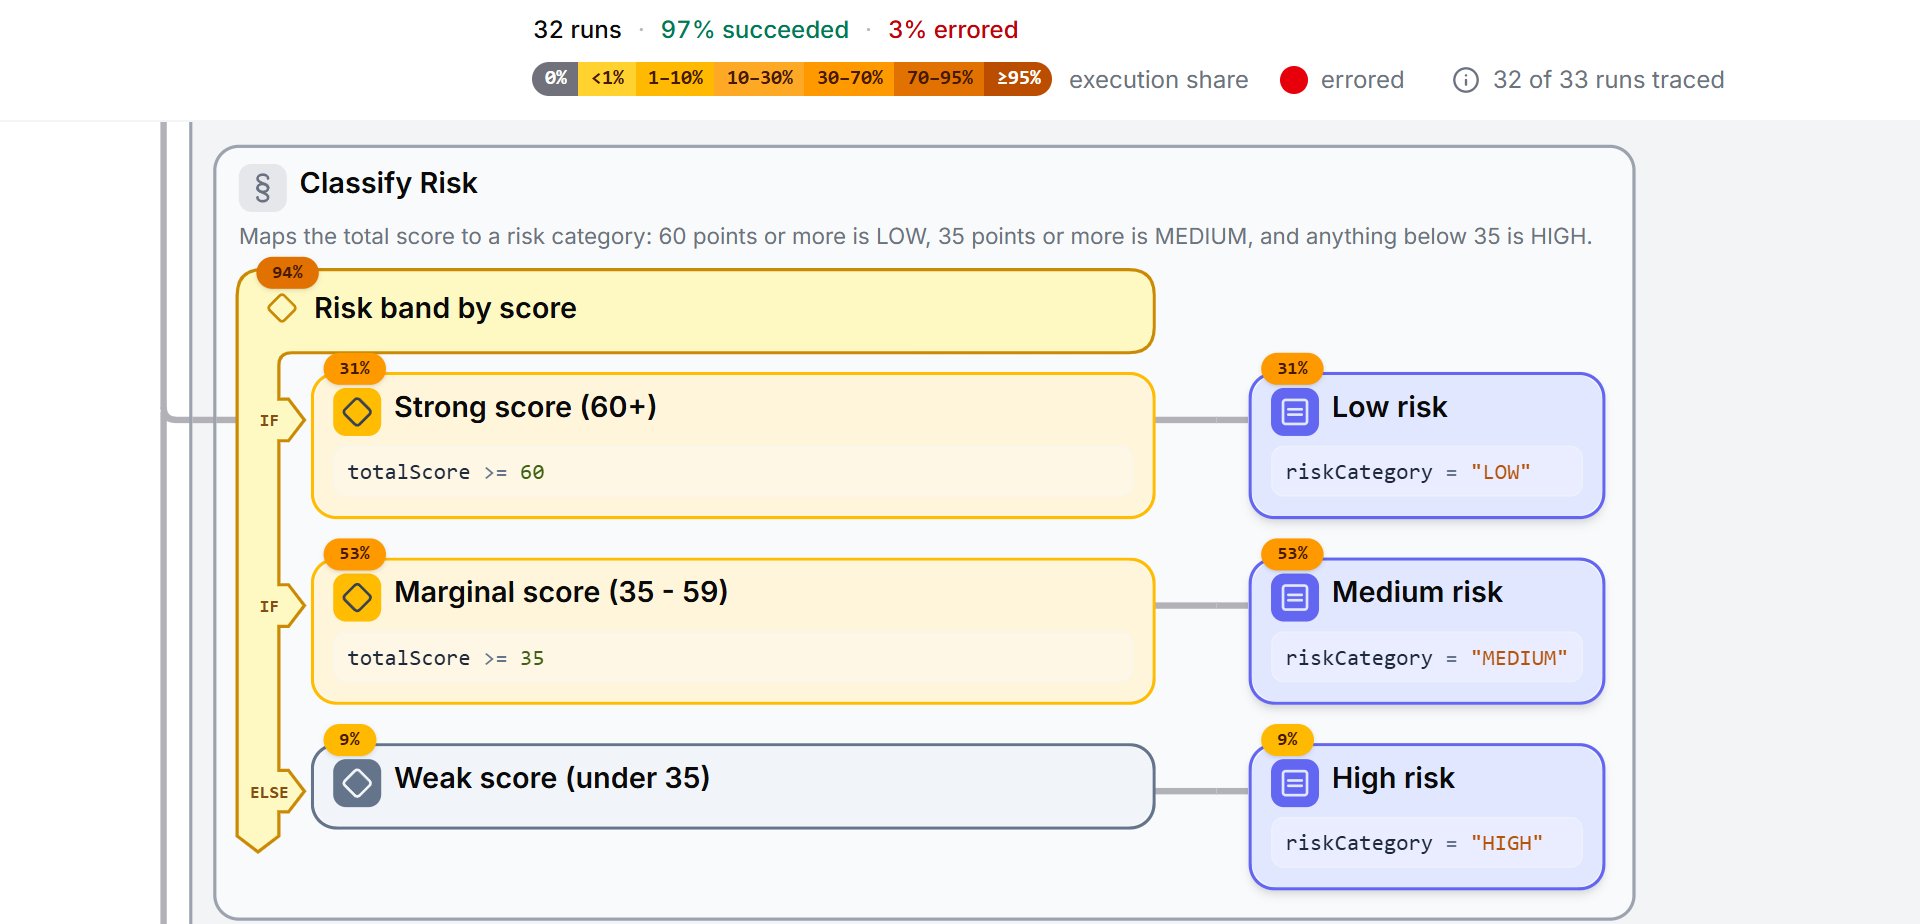
In the Classify Risk section, each node shows the share of runs that reached it.
One release at a time
Logic Usage always shows one release at a time, because different releases can contain different logic. Pick the release with the version filter. When there are many runs in the time window, the percentages are calculated from the newest runs. Hover over the info icon next to the scale for details.What to do next
- Prod Runs: replay a single run to follow its path
- Test Suites: cover the branches production uses most with tests