

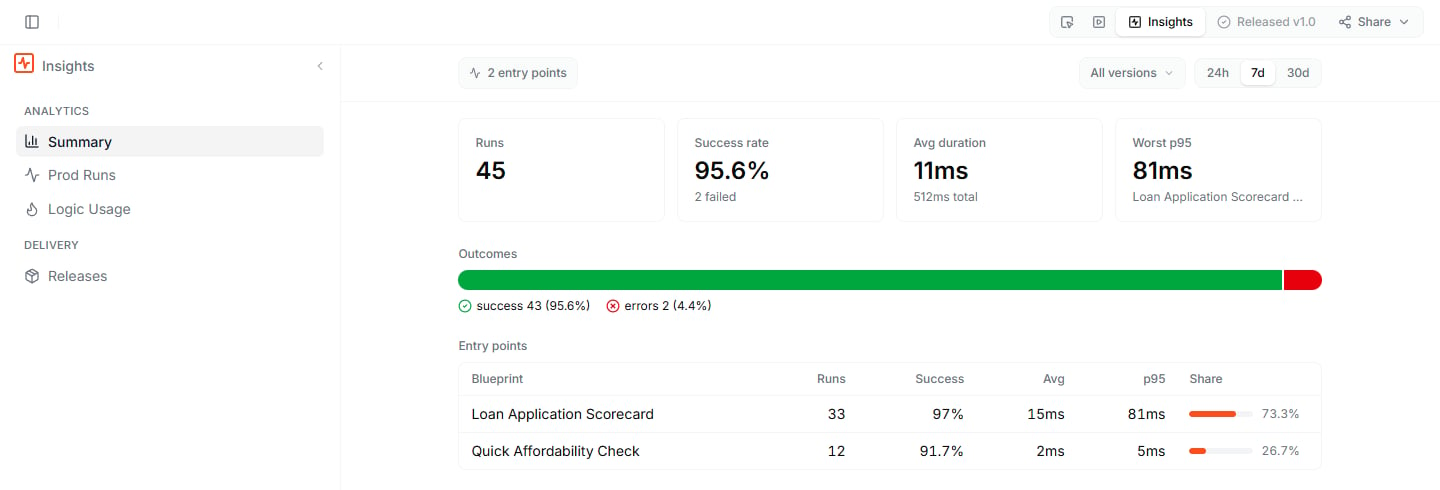
The Summary adds up the production runs and breaks them down by entry point.
The tiles
Outcomes and entry points
The Outcomes bar splits all runs into successes, errors, and timeouts. The Entry points table breaks the numbers down by public Blueprint: Runs, Success, Avg, p95, and Share of all runs.What to do next
- Prod Runs: look at the single runs behind the totals
- Logic Usage: see which parts of your logic the runs reach