

Open Insights
In the Blueprint Editor, click Insights in the view switcher of the top toolbar (Design | Playground | Insights). To return to editing, click Design. The rail on the left lists the sections:
Insights is available to members of the workspace. People who open the project through a public link don’t see it.
Time window and version
At the top of each Analytics section you choose what to look at:- Time window — 24h, 7d (the default), or 30d
- Filter by version — All versions, or one release. Use it to compare how a new release behaves against an earlier one.
Summary
The Summary shows the health of your project in the selected time window: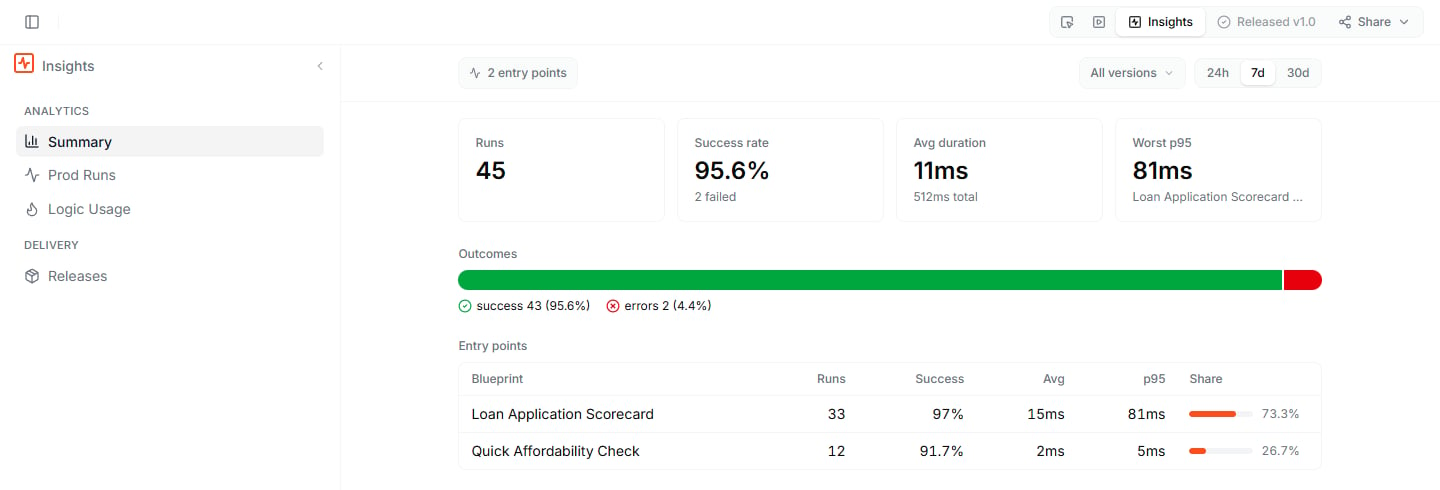
- Runs — how many production runs there were
- Success rate — the share of runs that succeeded, with the number of failed runs
- Avg duration — the average run time
- p95 duration — 95% of runs finished within this time. If the project has several public Blueprints, the tile is called Worst p95 and names the entry point with the slowest p95.
Prod Runs
Prod Runs lists the 50 most recent production runs. Each run shows its status, its duration, and the release it ran on. Narrow down the list with the filters at the top:- Status — All, Success, Error, or Timeout
- Search by correlation ID — find one specific run. Callers set the correlation ID with the
X-Correlation-Idheader, see Tag a run with a correlation ID. - The time window and the version filter described above
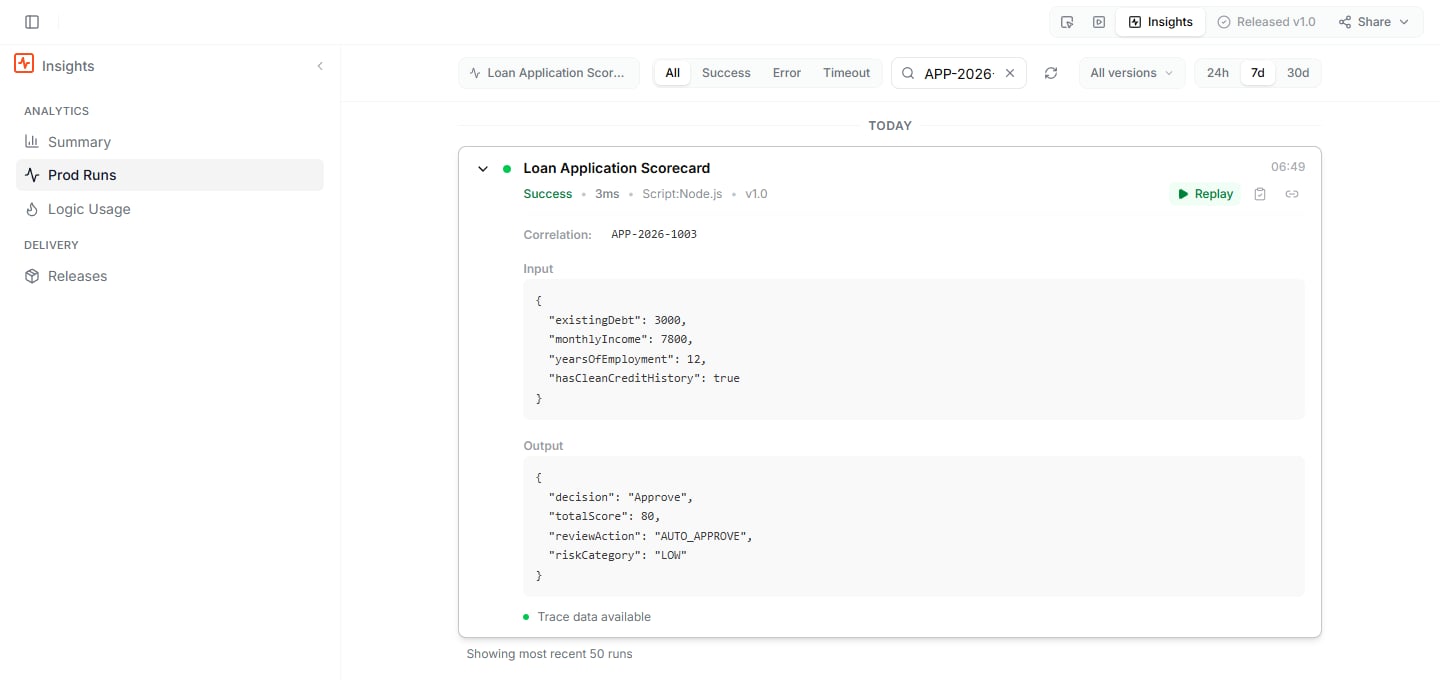
Replay a run
Click Replay on a run to open its recorded trace on the diagram of the release that ran. You can follow the exact path the run took, step by step. Replay does not run the Blueprint again; it shows what happened at the time. Click Runs above the diagram to return to the list. To share a replay with a colleague, click the link icon next to Replay (Copy link to replay).Create a test case from a run
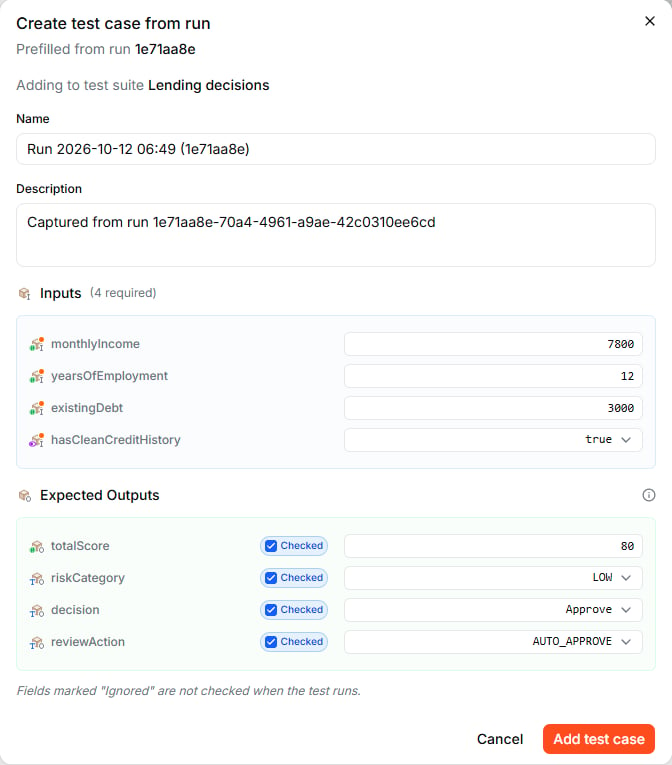
When a production run shows a case worth keeping, turn it into a test:- Expand the run and click the clipboard icon next to Replay (Create test case from run).
- The dialog is prefilled with a name, the run’s inputs, and its result as the expected outputs. It names the test suite the case is added to — if the Blueprint has no test suite yet, Leapter creates one.
- Adjust the values if needed. Each expected output is either Checked — compared with the actual result when the test runs — or Ignored. Click the pill next to an output to switch.
- Click Add test case.
Logic Usage
Logic Usage paints production usage onto your logic. Choose a Blueprint with Select blueprint: Leapter shows its diagram as it was in the selected release and marks every node with the share of runs that reached it. A node shown in red failed in at least one run.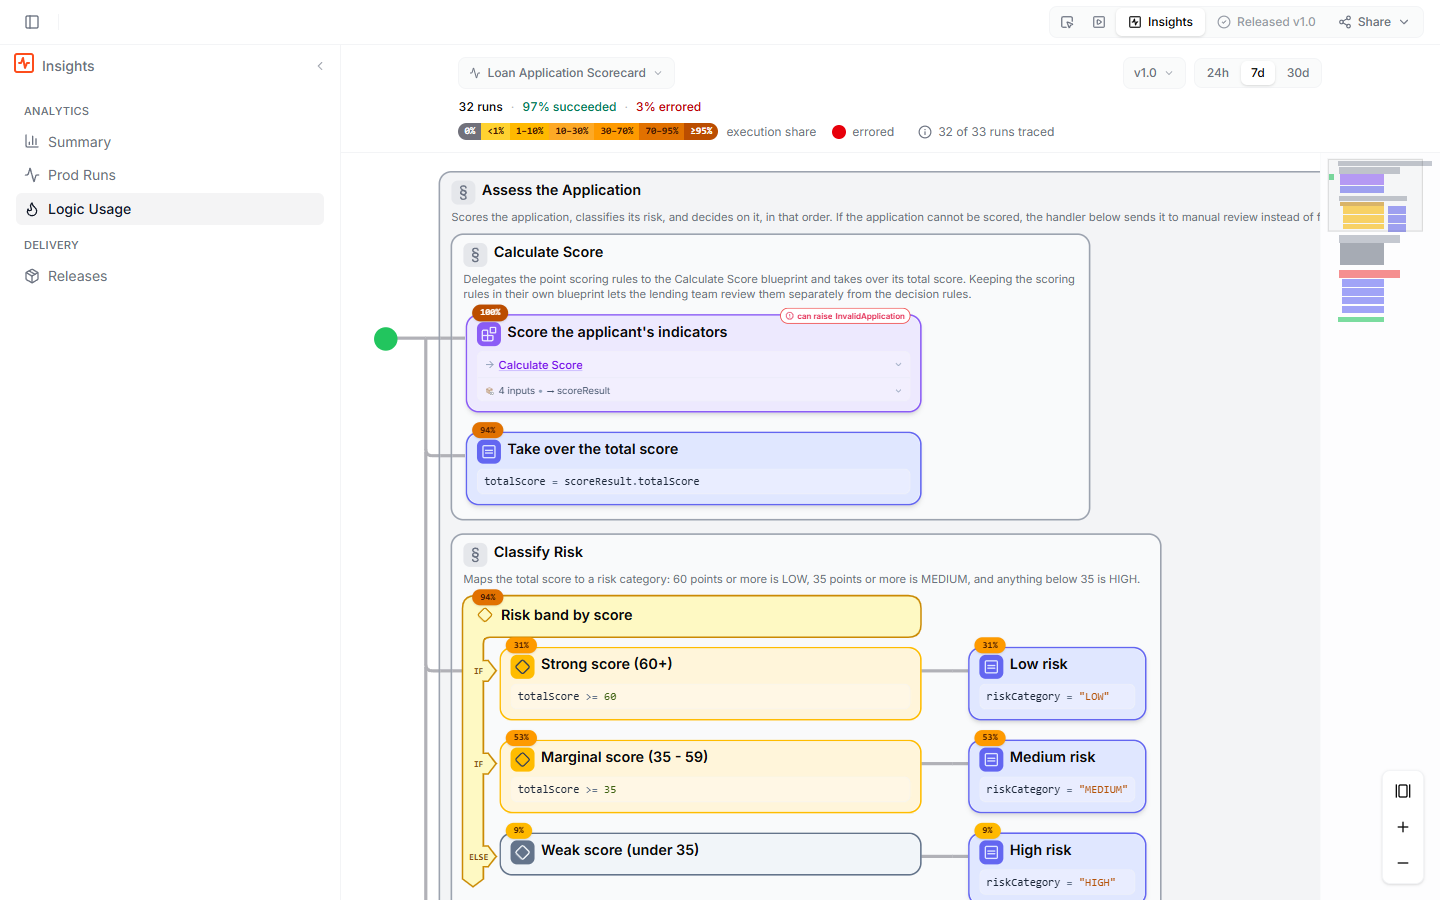
Releases
Releases lists every release of the project. The Latest release is the one production runs; older ones are listed under Earlier releases. Each entry shows the version name and description, its Content ID, who created it and when, the project version it was created from, and the number of Blueprints. Click Download to save the release package. See Releases to learn how to create one.No data yet?
What to do next
- Releases — create the release that production runs
- Test Suites — run the test cases you captured from production
- Web API (OpenAPI) — call your project from your applications