

Top toolbar
The top toolbar has three groups:
A — Run and debug
B — Edit and view
C — Mode, release, share
Editor settings
Settings opens five switches. Each one shows its name when you hover over it, and your choices are remembered in your browser.
On the type canvas, Settings also offers Layout: compact and Layout: columns to arrange the type cards.
Contents sidebar
The Contents sidebar on the left is the project’s table of contents. Click an entry to scroll the document to it; double-click a Blueprint or section to maximize it.Quick run from the Contents sidebar
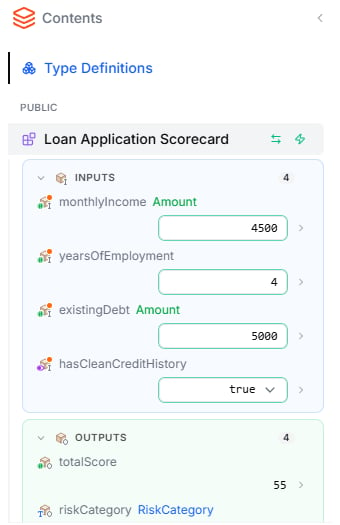
- Inputs — each input shows its name, its type, and a field to set a value
- Outputs — each output shows its name, its type, and its value from the most recent run
Right sidebar
The right sidebar holds the panels you work with next to the document. A tab strip at the top switches between them; the tabs show icons, and the active tab its name.
In the sidebar’s top-right corner:
- Detach panel — opens the Tests, Agent, or Findings panel in a separate window. Attach panel puts it back.
- › (Collapse right sidebar) — hides the sidebar; Expand right sidebar brings it back.
In the document
The Specification view has its own controls, most of which appear when you hover over a heading or a row:
The steps behind these controls are described in Specification View.
Node toolbar
When you select an element in a diagram, a small toolbar appears next to it with actions for that element. See Inline Editing.Search
Press ⌘K (Ctrl+K on Windows) or click Search (⌘K) in the top toolbar to open Search project. Type a word and Leapter searches the whole project — names, labels, descriptions, expressions, and values of Blueprints, types, tests, comments, and findings. Each result shows where it was found and what matched.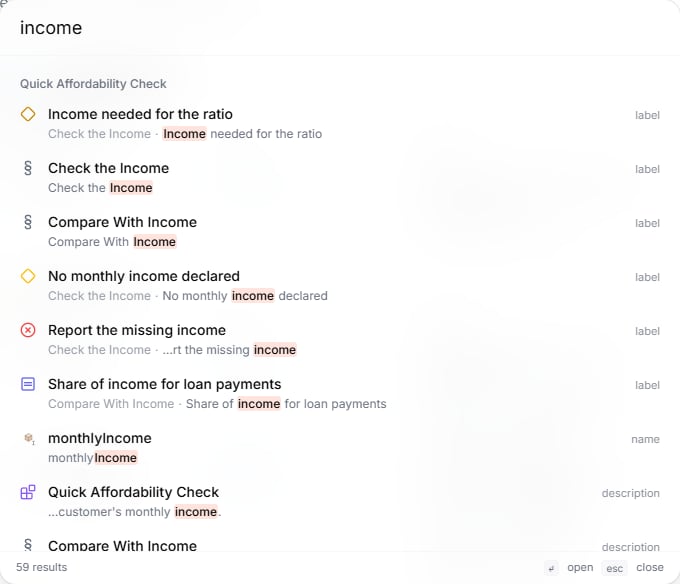
Keyboard shortcuts
What to do next
- Overview — the editor’s areas at a glance
- Specification view — read and edit the project as a document
- Test your Blueprint — run your logic and step through it