- Double-clicking a Blueprint’s entry in the Contents sidebar
- Clicking the maximize icon in a Blueprint’s section header
- Clicking a Call node’s link to open the called Blueprint
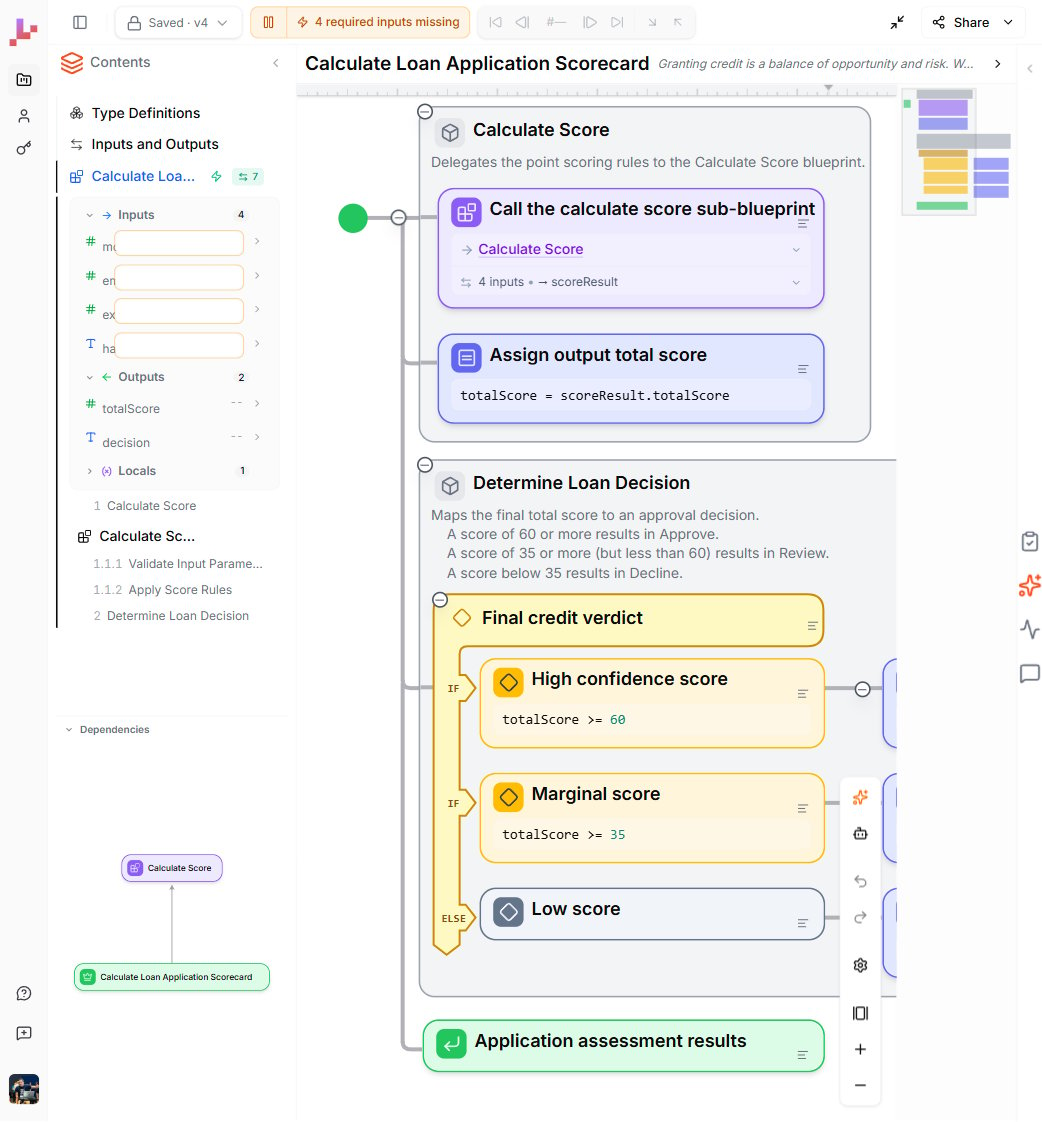
Reading the diagram
Execution flows top to bottom. Each element is color-coded by type:| Color | Element type | Purpose |
|---|---|---|
| Green (circle icon) | Start node | The entry point where execution begins |
| Yellow | Decision | Conditional branching — evaluates a condition and routes the flow (IF / ELSE) |
| Yellow | Section header | Labeled group with a title and description that explains a part of the logic |
| Purple | Assignment | Performs a calculation or sets a variable value |
| Green (check icon) | Return | Ends execution successfully and returns output values |
| Red | Error | Ends execution with an error condition |
| Blue | Call | Calls another Blueprint as a sub-routine |
The right-edge toolbar

Building and editing
Adding elements
You add new elements at connection points in the diagram — the small circles between existing elements. Click one to open the element palette, then select the element type you want to add. The palette offers: Assignment, Decision, Loop (items), Loop (counter), Loop (while), Error, Return, and Call. For a detailed guide on each element type, see Controlling the Flow.Editing elements
Double-click any element on the diagram to edit its configuration inline:- Decision nodes — edit the condition expression and branch labels
- Assignment nodes — edit the calculation or variable assignment
- Call nodes — select which Blueprint to call and configure input / output mapping
AI editing
Press Ctrl+I (or Cmd+I on Mac) — or click the sparkles icon in the right-edge toolbar — to open the AI prompt. The scope adapts to your selection: a single node, a section, or the whole Blueprint. See AI editing. For a conversation that can build across Blueprints and run your tests, open the Lab Agent (the bot icon in the same toolbar).Running and tracing
You can run the maximized Blueprint directly from the diagram. After a run, the execution path is highlighted on the canvas and the trace controls in the top toolbar become active — Step in, Step out, Previous, Next — so you can replay the execution step by step. While Live mode is running, the Blueprint re-runs automatically as you edit, and the Outputs footer at the bottom of the canvas updates continuously. For detailed instructions, see Test your Blueprint.What to do next
- Specification view — return to the document view of your whole project
- Controlling the Flow — learn about each element type in detail
- Inline editing — edit nodes directly on the canvas
- AI editing — modify your Blueprint with natural language